

metrics:read permission.
Open it at Analytics → Review Usage in the CodeRabbit dashboard.
For what draws down your allowance in the first place, how it refills, and how to spend fewer reviews, see Review rate limits.
My usage
The My usage tab shows your own review activity for the last 7 or 30 days. Administrators can open the same view for any developer from Team usage.
My usage showing key metrics, daily activity, and the current refill rate
Key metrics
Review events — every review run in the selected window. Rate limited — runs that reached your included limit, split intoN blocked · M continued. This card is not a count of reviews that failed to run. A continued review did run; it was billed as usage-based reviews instead of drawing from your included allowance.
Pull Requests — distinct pull requests with at least one review event, with review events per pull request underneath. A ratio well above 1.0 is the signal that incremental reviews, not new work, are consuming the allowance.
Daily Activity
Each bar is one calendar day in your local time zone, split by outcome:- Gray, Within limit — the review ran against your included allowance.
- Red, Rate limited — the review did not run on that attempt.
- Green, Continued with credits — the review exceeded the included limit and ran through credits or usage-based billing.
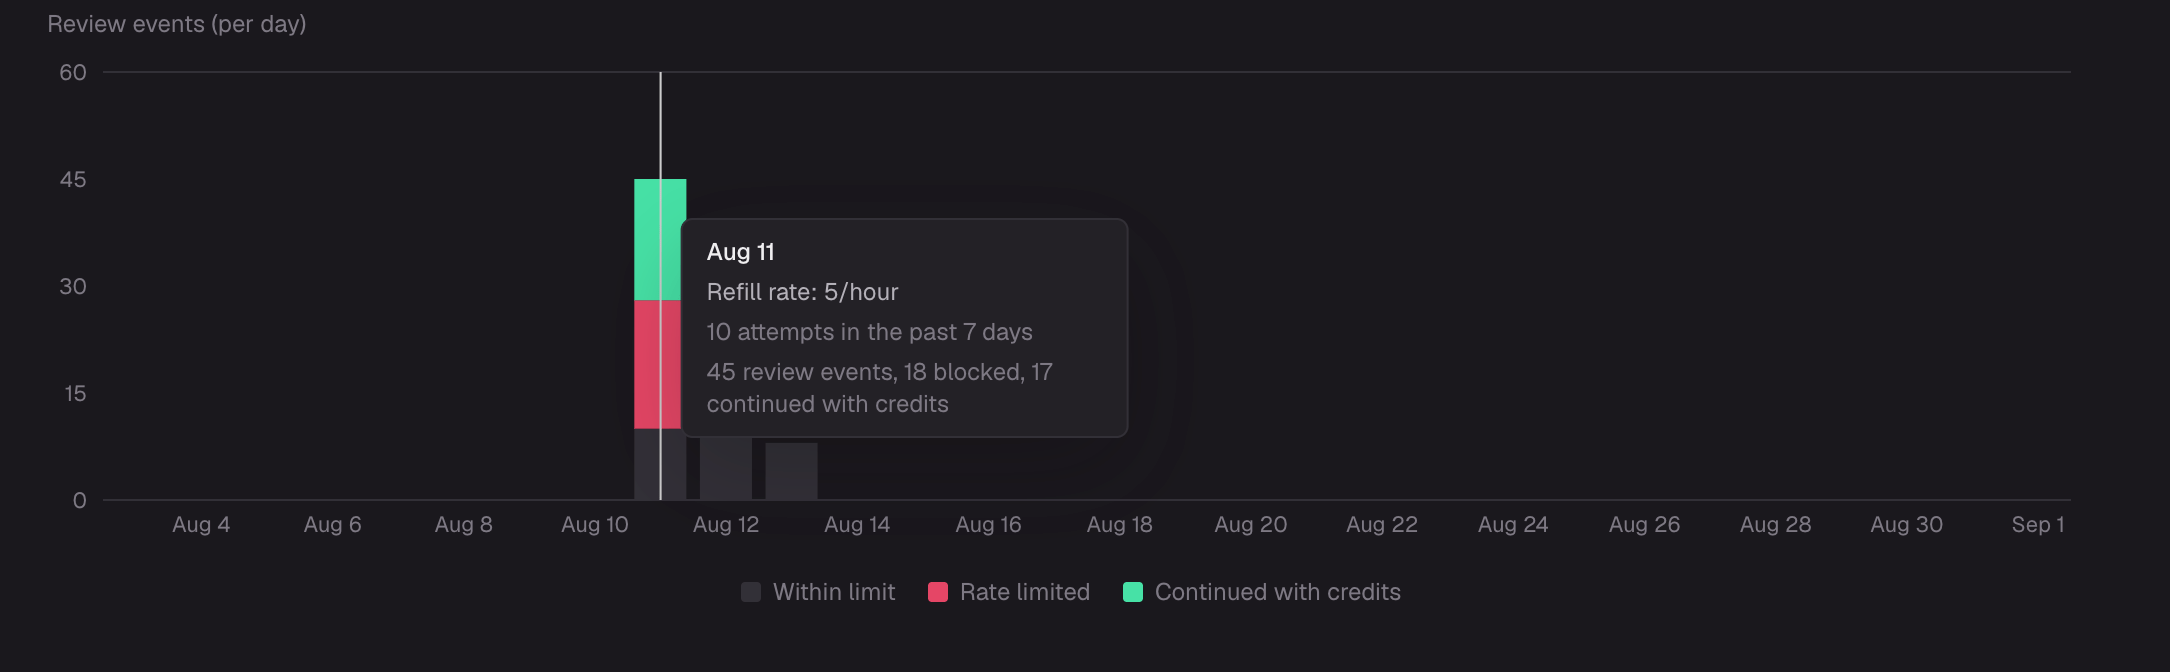
Hovering a day shows the refill rate in force, the rolling attempt count, and the outcome split for that day
The chart always renders exactly 7 or 30 calendar days ending today, while the cards above it cover a rolling window measured backwards from right now. The two do not have the same edges, so the bars are not expected to add up to the card totals.
Limit history
Limit history lists the points where your observed limit changed, labeling each as an increase, a decrease, or the first observation in the window. When the limit held steady, it says so in one line rather than listing every event. The section stays collapsed by default and shows the eight most recent changes. For Enterprise, the chart and Limit history can retain historical adaptive periods after a return to fixed limits, even when the Last observed rate panel is hidden. Fixed-limit observations are not labeled as adaptive points. Being on the Enterprise plan alone does not indicate enrollment in adaptive limits.Review Log
The Review Log lists the individual decisions behind the numbers above. Both views share a search box, an Outcome filter for Within limit, Rate limited, and Continued with credits, and the day filter set by the chart. Pull requests groups events by pull request, most recent first, and summarizes each group as review events, incremental reviews, findings, and rate-limit outcomes. Sort by Recent activity, Most review events, or Most files reviewed to find the pull requests that consumed the most.
Review Log grouped by pull request, showing review events and findings per PR

Review Log in Timeline mode, one row per review event
Reading a single pull request
Expanding a pull request shows every review event it produced.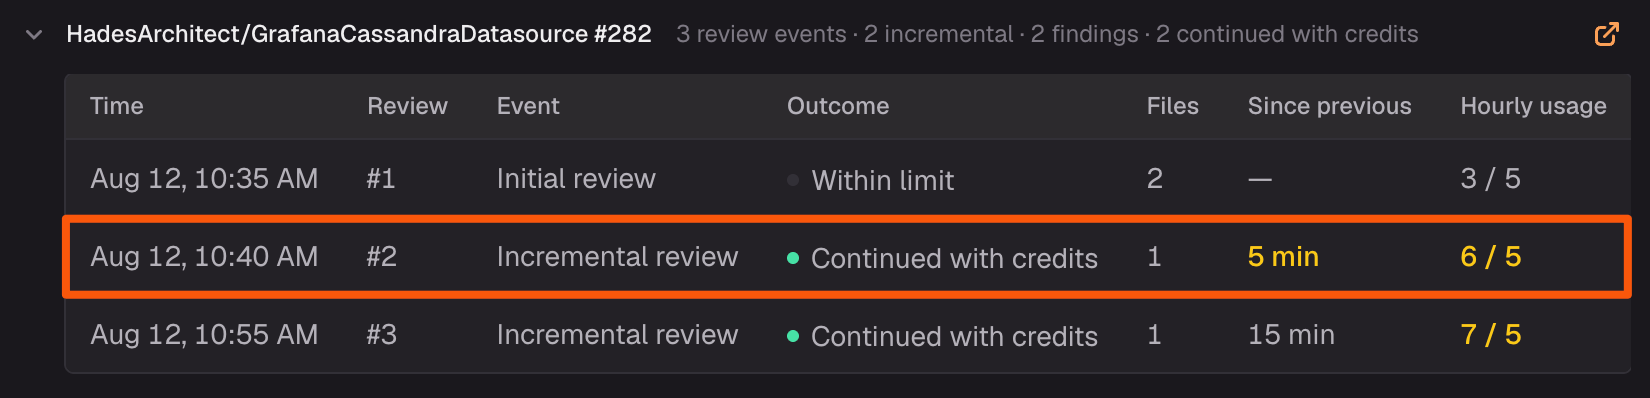
A pull request that produced three review events in twenty minutes, two of them over the hourly limit
Initial review and Incremental review are inferred from the order of the events on screen, and Hourly usage is reconstructed from the events loaded into the page. Both are close enough to read patterns from and are not exact accounting.
Team usage
The Team usage tab aggregates the same data across your organization. Users affected counts developers who hit their included limit at least once, as a share of developers with any review activity in the window.
Team usage with organization totals and per-developer review activity
1 of 1 or 1 of 20 and a single row holds nearly all of the review events, the organization’s reviews are landing on one bot or service account rather than spreading across seats. See One identity for every pull request.
When more than half of your active developers, or more than half of your review events, hit the included limit, a callout appears above both tabs offering to enable usage-based reviews or raise your monthly cap. It is visible to administrators who can manage the subscription.
What the numbers do and do not mean
Review Usage is operational telemetry. It is precise enough to diagnose a consumption pattern and is not a billing ledger — for billed usage, see Subscription and Billing.
Review Usage loads the 100 most recent events, up to 500 for a single selected day, and up to 500 developers in Team usage. When a limit applies, the page says so on screen.
Three counters that are easy to confuse
The dashboard, your hourly allowance, and the Fair Usage Limits Policy each count something slightly different. A blocked push is the clearest example: it appears on the dashboard, but it costs you nothing and does not push you toward a lower adaptive limit.
For enrolled Enterprise developers, the rolling activity counter includes only delivered native Git reviews within the included allowance, counted per developer within the organization. It excludes blocked attempts, reviews superseded before delivery, and paid continuations. The counter resets at the confirmed billing period start, so earlier reviews do not affect the current refill rate even if they are within the past 7 days. This counter is separate from the dashboard’s review-event count and selected 7- or 30-day display window.
What’s next
Review rate limits
Learn what counts as a review event, how your allowance refills, and the patterns that exhaust it fastest
Automatic review controls
Pause incremental reviews, opt in by label, and exclude work-in-progress branches so reviews run when you want them
Plans and pricing
Compare per-developer review limits, file limits, and chat limits across plans